A number of interesting items that are a little more time-related than I normally talk about.
Some sociology for amusement:
Nation's Climatologists Exhibiting Strange Behavior h/t Michael Tobis.
Regarding some of Roy Spencer's latest Well, give me more than 30 parameters, and I can fit a trans-dimensional lizard-goat ... by Barry Bickmore. I've downloaded the other recent paper and will take it up as my time and interest permits. A couple people have already asked about this, so read Barry's notes in the mean time.
Some fun science, and a reminder to beware of gifts bearing Greeks:
Phil Plait on Earth's first Trojan Asteroid
... and the NASA press release on it.
Trojan asteroids do not, it turns out, contain Greeks. Apparently that is limited to a horse in the Iliad. What happens is that if you have two bodies that are very much more massive than a third, like, say, the Sun and Earth compared to an asteroid, you can park an asteroid on the earth's orbit, but 60 degrees ahead or behind. And it will pretty much stay there. The 60 degrees ahead or behind are called the 'Trojan points'. We've long known of bunches of Trojan asteroids for Jupiter. As Phil's title suggests, this is the first time we've found one for the earth.
That's a bit about the doing of science: There was every reason to believe that the Earth had trojan asteroids. It would actually have been quite remarkable if we didn't -- gravity is supposed to work the same way for us as for Jupiter (allowing for the fact that we're so much less massive). Still, we're happier to see what we expected.
29 July 2011
28 July 2011
Best Frenemies
A friend refers to another scientist as his best enemy. The important thing about this is, he is not angry or upset about the other scientist. I'll call them John and Jane, John being the one I know. John and Jane are both outspoken people. Consequently, at meetings the two of them spend a fair amount of time disagreeing with each other. And they disagree vigorously.
That vigor is part of what makes Jane a best enemy for John. John's not a quiet person himself. So it would be easy for him to vigorously say what he thinks is true and other people to quietly agree, because no other ideas were presented, or to quietly disagree. Quiet disagreement would be worse. It would mean that John would not have a chance to explain the parts of his thinking that would persuade those people that he was right after all. With a vigorous enemy, however, John can be confident that Jane will bring up those points that aren't clear to other people. And then John can explain them. After this, if anyone disagrees with him, there's a fair chance that it's because he doesn't really have things right himself. And he also has a chance to change his thinking, to arrive at something even better than what either he or Jane thought were the case when the two started their discussion.
The even larger bonus is that whatever conclusion John and Jane reach personally, they're confident that the entire audience knows what is the real topic of discussion, and why they each think as they do. This puts enough substance on the table for the audience to be making good decisions. If John's position isn't the one that some in the audience walk away with, that's fine. He's going to keep thinking about the topic himself and maybe decide that something closer to Jane's original position is more correct. Or maybe he realizes that there's a better way of describing why he thinks as he does. Either way, some scientific progress is made.
Another part of what makes it work is that their discussions, regardless of how vigorous (an uninformed observer might say 'violent'), are technical. Both of them have serious professional reasons for their conclusions. And it is those professional reasons they turn to, not cherry picking starting points for time series trend analysis and other dishonest or ignorant methods.
A final matter that makes it work is that neither of them is personally upset by the fact that they have professional disagreement. Both apparently rather relish it. After spending 8 hours at the meeting disagreeing with each other about almost everything under the sun, they go out to dinner together and chat pleasantly about other topics.
Strictly speaking, I only have 'John's view of matters. I don't know 'Jane'. Still, they've been doing it for decades now, and I think even of 'John' were extremely clueless about other people (and my observation is that he is fairly clueful), he'd have picked up on 'Jane's differing viewpoint.
Names and genders may well have been changed for the purpose of the story telling. The people and descriptions are otherwise accurate.
26 July 2011
How not to compute trends
Did you know that scientists are lying about the trend in sea ice extent? That's the conclusion if you apply the popular trend analysis technique those who claim that the earth has cooled, or 'not warmed', since 1998, or 2005. The probable reason you don't hear about this is that the 'lie' would be that scientists are grossly underestimating how drastic the trend to less ice is if you believe that method.
The method used to claim that there's a cooling trend, or no warming trend, is to cherry-pick a too-recent start year that is exceptionally high and compute the difference between that and a particular recent year (any one, repeat the 'no cooling trend for the last decade' for years afterwards, even if more recent years are warmer).
So I'll take a recent year that had large sea ice extent -- 1996, and compute the trend between there and a recent year that had a low extent -- 2007. Here's the straight line computed that way, plotted against the observations between 1996 and present. These data are September ice extents from the NSIDC:
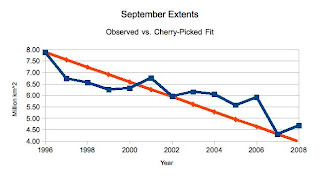 And from eye-inspection of it, it even looks like the average error is about 0. Sometimes high, sometimes low. This trend is for ice pack extent to lose about 330,000 km^2 per year, against the about 78,000 km^2 that is computed for a linear trend by climate scientists. Clearly climate scientists are trying to hide the decline!
I've already done some things more honest than what the 'no warming since 1998' folks do, not least is, I showed you the trend line and the data. But this is far from sufficient to have a reasonable trend analysis.
The method used to claim that there's a cooling trend, or no warming trend, is to cherry-pick a too-recent start year that is exceptionally high and compute the difference between that and a particular recent year (any one, repeat the 'no cooling trend for the last decade' for years afterwards, even if more recent years are warmer).
So I'll take a recent year that had large sea ice extent -- 1996, and compute the trend between there and a recent year that had a low extent -- 2007. Here's the straight line computed that way, plotted against the observations between 1996 and present. These data are September ice extents from the NSIDC:

I've already done some things more honest than what the 'no warming since 1998' folks do, not least is, I showed you the trend line and the data. But this is far from sufficient to have a reasonable trend analysis.
22 July 2011
Reconsidering forecasts and wagers
Comments in two different threads suggest that there's some good room for more discussion. Yesterday, I noted that if someone would only take a bet at 50 to 1 odds, he wasn't very confident about his side of the bet. Certainly not the 'just as likely to warm as cool' that was the statement which prompted the bet. (Nobody here, by the way.) As M commented, and I assume that he mean in terms of real money, he'd want 5:1 odds even on an even money situation. I wouldn't mind that myself (again, I don't bet real money, but in examining the mathematics of expectation, that's how it goes).
For illustration of a concept that was in my mind, but not in the prior post, I'll pick up with Alastair's comments about his predictions and preferences for odds. The thing is, the odds that you're willing to accept also describe what you think is really the case. At least it's much closer than in the case that your lunch money is riding on the bet and you're already hungry. Our situation here is betting something that doesn't exist (quatloos) and presuming that we can make a lot of bets, so that we can average out the wins and losses over time -- converging towards the mathematical situation.
I make use of this in group settings when lunch place selection is being discussed. In a group of, say, 6, all will claim to have no preference between places A and B. I pull out a coin and say, fine, heads it's A, tails it's B. An amazing number of people suddenly develop a preference for one or the other.
So it goes with Alastair's estimate of 3.9 million km^2 against mine of 4.4. His original estimate for uncertainty was 0.1 million km^2, while mine was 0.5 million. I'll add a curve for him, where the uncertainty is increased to match mine; that'll be the 'Alastair-2' curve:

21 July 2011
Sea Ice Wagers
I'll hang out the shingle here for folks who want to talk about sea ice wagers with me. Keep in mind that I don't bet real money, quatloos instead. Call them points of honor.
I don't take any of this very seriously. Seriously enough to mention that so far, I have won all my wagers of quatloos.
The serious part is how rapidly pseudoskeptics leave the room if one raises even a casual honor bet that takes their statements seriously. People who claim that temperatures are just as likely to go down as up demand 50:1 odds if challenged to a bet on whether temperatures will go up or down. If they believed what they were saying, they'd take 1:1 odds, and be happy with either side of the bet.
Last fall as I was evaluating the seaice ... statements from Wattsupwiththat , Joe Bastardi declared (over there) his belief that September 2011 ice would be at least 5.5 million km^2. If anyone can find Bastardi's address, I would be happy to bet quite a few quatloos with him. If he believed what he said, he should pay off infinity to my 1 if ice is less than 5.5 million km^2. I'll pay him 1 if it's over.
20 July 2011
Making your own sea ice estimates
The Sea Ice Outlook does accept estimates from outside the professional community. Maybe not everybody involved is thrilled by this, but I do think it's a good idea from my distant vantage. And Jim Overland, one of the people behind the SIO, is strongly in favor of it. (I had a chance to talk with him about the outlook and other ice matters a few weeks ago.)
In the most recent report, there are 3 submissions from 'outsiders' -- Chris Randles (you've seen him comment here as crandles) and Larry Hamilton, both at Neven's Arctic Sea Ice Blog, and one from Wattsupwiththat.
Watts' entry was a poll of readers. While perfectly legitimate as an entry, it's also perfectly useless scientifically. One goal of science is to gain understanding of the system in order to spread the knowledge around. Polling can't be spread.
Much more interesting are Chris's and Larry's methods. Both are obviously methods of great brilliance, as they currently have the same estimate as I do from my statistical method -- 4.4 million km^2 for this September. Beyond that, you can read their method descriptions in the Sea Ice Outlook report and start constructing your own method by not making the mistake they and I have made. Whatever those turn out to be. Larry Hamilton's write ups (one for ice extent, one for volume) are:
http://neven1.typepad.com/blog/2011/04/trends-in-arctic-sea-ice-extent.html
http://neven1.typepad.com/blog/2011/04/trends-in-arctic-sea-ice-volume.html
And you can also examine model output from the PIPS replacement model ACNFS, PIOMAS, and CFS as a basis for making your own estimates. (And please do cite others that you know of.)
All are welcome to post your methods here in addition to (or instead of) at the SIO.
19 July 2011
Adding to the blogroll
Finally got around, after broken wrist and other hiatus, to adding http://blogs.chron.com/climateabyss/ to the blogroll. Thanks -M for the suggestion.
Other suggestions welcome. As always, I aim for sources that lean to the educational -- science content rather than political policy.
Other suggestions welcome. As always, I aim for sources that lean to the educational -- science content rather than political policy.
18 July 2011
2011 Sea Ice Outlooks
For 2011, I added a third method of estimation. Or, rather, I talked with someone who was using a third method and helped refine it some. Our guesses are 4.4, 4.8, 5.0 million km^2 for September monthly average sea ice extent as computed by NSIDC.
Again, I'll put our estimates in context of some other estimation methods.
The two climatology means (22 and 30 years) are relatively close to each other, and are far away from anything we've seen in years. Taking the 30 year trend, from the first 30 years of the satellite record, gives 5.31 million km^2, which is close to a figure seen in recent years (5.36 in 2009), but well above any of our estimates or the 4.9 seen last year.
Below the fold for a few more words about our 3 estimates:
Again, I'll put our estimates in context of some other estimation methods.
- Climatology 1979-2000: 7.03 million km^2
- Climatology 1979-2008: 6.67 million km^2
- Linear Trend Climatology 1979-2008: 5.31 million km^2
- Wang, Wu, Grumbine model: 5.0 million km^2
- Wu, Grumbine, Wang model: 4.8 million km^2
- Grumbine, Wu, Wang statistical ensemble: 4.4 million km^2
The two climatology means (22 and 30 years) are relatively close to each other, and are far away from anything we've seen in years. Taking the 30 year trend, from the first 30 years of the satellite record, gives 5.31 million km^2, which is close to a figure seen in recent years (5.36 in 2009), but well above any of our estimates or the 4.9 seen last year.
Below the fold for a few more words about our 3 estimates:
17 July 2011
How large a conspiracy?
Did you know that the observed decline in Arctic sea ice cover is all just a fake? I didn't, but encountered folks who thought so. Since I'm one of the people who would have to be involved in the conspiracy or at least being duped by the masterminds, I'll take a minute to ponder the matter and how someone who does not personally know many of the people involved could go about deciding whether there was indeed such a conspiracy.
One of the tools I find useful in considering issues is to follow a common mathematician's approach -- called the reductio ad absurdum. That means reduction to absurdity. What you do is assume the thing at hand to be true, and then pursue it logically to see where you go -- whether it leads you to absurdity. This is also the starting point for a proof by contradiction. Again, assume the thing to be true and see if it leads logically to a conclusion that contradicts what you know to be true.
So let's assume that there is indeed a fake involved in the decline in Arctic sea ice. The people involved were a little particular -- the passive microwave sea ice record.
Some questions to pursue, then:
- How long would the conspiracy have to have lasted?
- How much data would have to be faked?
- Who all would have to be involved in the fakery?
- Are there other sources of data to confirm or refute the passive microwave observations?
16 July 2011
Happy Anniversary ...
... to me and my wife. Part of the recent hiatus is due to me taking some time off to celebrate my 5th wedding anniversary with my wife. I've marked this as a 'being a scientist' post since being a spouse is another thing that scientists do. I enjoy that, and others of my roles -- being a son, father, uncle, brother. Science is another, of course, and I enjoy that too, and is the point of the blog. But a secondary point is that scientists are people.
We took the time, among other things, to think about what we have done in the 5 years so far -- good ideas we've carried out, storms we've weathered, and so forth. And to think about what kinds of things we might like to try in the next 5. There's a bit of science there -- experiments. We try things, and some we like and keep doing, and some we don't, and quit. Probably none of these experiments are publishable, but that's not the point. We learn what we're trying to learn. And have a lot of fun along the way!
We took the time, among other things, to think about what we have done in the 5 years so far -- good ideas we've carried out, storms we've weathered, and so forth. And to think about what kinds of things we might like to try in the next 5. There's a bit of science there -- experiments. We try things, and some we like and keep doing, and some we don't, and quit. Probably none of these experiments are publishable, but that's not the point. We learn what we're trying to learn. And have a lot of fun along the way!
Subscribe to:
Posts (Atom)

