One of the things I like to ponder is how to decide whether something is science or not. An attempt to come up with a clear demarcation criterion is Karl Popper's, which gets more widely distributed as being "If it isn't falsifiable, it isn't science." I'm not sure what he said himself, but philosophers tend to write books on these topics, rather than short sentences, so I'll guess that some details are lost in this version.
The question arises here because a recent question at the question place (yes, Robert, that's exactly what it's for) mentioned Popper. I'll give a different response and discussion here. (Same conclusion*).
For some cases, Popper's falsifiability criterion works well. Religion is not science. There is no observation, experiment, or test that will tell someone that their religion is wrong. No matter what you observe, the religion can accommodate it. Same thing for mathematics, actually, as it isn't necessarily concerned with observations. Unfortunately, those (theology and mathematics) are the only two areas which can lay claim to absolute Truth (of a sort -- mathematical truth is only about mathematical things). Science is left with only approximate truth -- the theory seems to work pretty well, the observations are pretty reliable. But not absolutely reliable, and not absolutely perfectly.
For others, though, it's more difficult. In the later 1800s, astronomers observed that the planet Mercury wasn't where it was supposed to be according to Newton's laws. Its point of closest approach to the sun (perihelion) was moving by 43 seconds of arc per century too much$. If Popper's criterion were correct, astronomers and physicists should have immediately thrown out Newton's laws and gone looking for something else. Instead, some patches were suggested -- like a planet 'Vulcan', orbiting even closer to the Sun than Mercury, in just such a way to cause Mercury to behave as observed. But it was never observed. Eventually, Einstein proposed his theories of relativity to expand on Newton's laws. Among other things, they explained why Mercury wasn't where Newton expected it to be.
For climatology, Popper is not so much relevant, or at least doesn't pose very much difficulty.
14 November 2011
11 November 2011
Veteran's Day
I'll take this chance to thank Veterans for their efforts to preserve our civil liberties and freedoms. That including one of my sons.
I'll also take the opportunity to thank and encourage another of my sons in his exercise of his civil liberties and freedoms -- in spite of the slander campaign now being waged against him. Or, really, because of it. You don't get that kind of response unless you're doing something right.
I've never really done anything that would peeve people of that kind of power. But, in their different ways, all three of my sons are doing so.
07 October 2011
AMSR-E failure and fallout
Update 17 October: The meeting last Tuesday gives little hope. There will definitely be no data for weeks. I don't know what prevents a conclusion of never.
original:
AMSR-E has failed and is probably permanently out of commission. For most of you, that's merely news. Perhaps a source of amusement and interest is now gone. For me, since I use(d) it in my day job, AMSR-E failing means some real work. Most of that work was already planned, but now it needs to be done more speedily.
As I've often said here, and even more often in 3d, data are messy and ugly. One sort of ugliness is that instruments do not last forever. When (not if) they fail, you have to turn to a different instrument. Ideally, you already have the replacement in hand and have been running it regularly and intercomparing its results with your current main system and ensured that there are no differences other than those you wanted -- like better resolution on the new instrument. The present situation is not ideal, so, as we usually do in science, I'm making the best of it that I can. And making notes for what to do when I have a chance to rework the immediate fixes.
04 October 2011
Climate change science history
A question at the question place regarded this history of climate change science. See that link for the full question. Here's my response, which over-ran the blog comment length limit there.
On the historical link side, the best single source is Spencer Weart's _The Discovery of Global Warming_ http://www.aip.org/history/climate/index.htm I think he under-rates the significance of G. S. Callendar's work in the 1930s-50s, but that's my take and I haven't yet written it up formally. It's an idea I've had, to do so. Unfortunately, a lot of Weart's work will probably pass your students' level. But you should be fine with it yourself and translate suitably to your students.
A different matter for your middle schoolers is the time scale of the history. Perhaps combine this with a project to collect family history?
I'll take your students as being about 11. Let's go with 30 years per generation, which is, at least, fairly accurate for my family. That means your kids born in about 2000, parents about 1970, grandparents in 1940, great-grandparents in 1910, great-great grandparents in 1880, great-great-great grandparents (g3 grandparents) in 1850, and g4 grandparents in 1820.
The history is:
03 October 2011
Happy Huskies
Not a post about the U. Washington, Seattle teams, who I'm sure do fine. Instead Alaskan Huskies I visited on my vacation:


This was at the Chena River Village, which I'll be talking more about later. The huskies are, of course, adorable in their own way. That's sufficient, of course, but there's also some science involved.
These are Alaskan Huskies, of course. The major distinction between Alaskan and Siberian, to borrow a description from an Alaskan musher (not the one above with her lead dog) is that the Siberians are 'Disney Dogs' -- selected for prettyness. There might be some regional bias involved.
27 September 2011
Question Place
I'm now back from my hiatus from the net, and will be putting up pictures and science comments on them over the next few days/weeks.
But first, here's a place and chance to ask questions and make suggestions. I've been pretty thoroughly off-net since the 8th, so please be sure to provide links if you're asking about recent events. (See the link policy; links to science content are good things whether I've been off-net or not.)
But first, here's a place and chance to ask questions and make suggestions. I've been pretty thoroughly off-net since the 8th, so please be sure to provide links if you're asking about recent events. (See the link policy; links to science content are good things whether I've been off-net or not.)
08 September 2011
Off net
I'll be off net for a while. When I get back, I'll finally hang out the shingle for a question place. Arctic ice will have pretty much revealed by then which, if any, of my guesses was best.
03 September 2011
Peer review and Wagner Resignation over Spencer and Braswell
"It's peer review, not God review" My wife's comment about peer review seems particularly apt for the current tempest regarding the resignation of Wolfgang Wagner from his post as editor in chief of the journal Remote Sensing. It regards a paper I mentioned in July, and related to the one that prompted Barry Bickmore to suggest "Just Put the Model Down, Roy".
I won't be taking the usual line of consideration here (surprise!). Rather, let's go back to talking about peer review. As my wife said, it is not God review -- reviewers and editors are human, and therefore make mistakes. At the end of peer review, therefore, you don't have gospel, you have something that has a fairly good chance of being worth your time to read. To rephrase Wagner, papers that pass peer review should at least not contain fundamental errors of method or false claims. And it now seems likely to him that this paper (Spencer and Braswell) may well not pass that standard.
Richard Feynman's comment about fooling yourself is commonly quoted:
We've learned from experience that the truth will come out. Other experimenters will repeat your experiment and find out whether you were wrong or right. Nature's phenomena will agree or they'll disagree with your theory. And, although you may gain some temporary fame and excitement, you will not gain a good reputation as a scientist if you haven't tried to be very careful in this kind of work. And it's this type of integrity, this kind of care not to fool yourself, that is missing to a large extent in much of the research in cargo cult science. "Cargo Cult Science", adapted from a commencement address given at Caltech (1974)
This underlies some parts, I think, of the failure in Spencer and Braswell's work, and the subsequent failure in the review and editorial process. Namely, it is assumed by reviewers and editors that authors have already done some work doubting themselves and checking to see how it is they might have fooled themselves -- and to take action against such possibilities. Further, the review process is based on the presumption that your purpose in publishing is to advance our understanding of science.
31 August 2011
Too-early consideration of sea ice estimates
I won't let it stop me, but considering that it is still August as I write, it's premature to evaluate estimates of September's sea ice extent. On the other hand, it's fun and easy, and some parts make sense even at this early date.
Last May I made, with colleagues, some estimates for September 2011's extent. As usual, I also included some other forecasts for comparison. The NSIDC figure for August 29th is:
 Where I've added lines in red for the 30 year mean climatology of September extents (6.67 million km^2), the mean monthly September extents if we take a 30 year linear trend (5.31), and lines at 5.0 and 4.5 million km^2.
Last May I made, with colleagues, some estimates for September 2011's extent. As usual, I also included some other forecasts for comparison. The NSIDC figure for August 29th is:

30 August 2011
Earthquake followup
Phil Plait showed the spectacular animation of seismic waves propagating across the US from the 5.8 Virginia earthquake last week, but left out part of the story. A commenter, davenquinn, picked up some details. If you look at the video:
you see an enormous number of sensors in the Midwest and Great Plains. These are areas not known for seismic activity, so what are they doing with so many sensors?
They are part of a travelling array (the 'transportable array') of seismometers, part of the Earthscope initative from the National Science Foundation.
The idea is to have a substantial number of seismometers moving stepwise across the US every few years. Then, having a dense array of seismometers, particularly to have them in places that we don't normally, will show us things that we don't normally see. That spectacular wave propagating across the country is one of those things. Get in to the data and you start seeing that the seismic waves didn't travel the same speed in all directions. And that tells us something about what the earth is made of. No idea what is up, but take a look at the Texas-Louisiana area. Early in the propagation of the waves, they follow along with the rest of the US. But later in the animation, that area shows much larger amplitude variations. Why?
In other words, more fun science to be done!
27 August 2011
Now twittering @rgrumbine
My thoughts, between earthquake, stolen wallet, and hurricane, are now more in line with twitter than blogging. I'm @rgrumbine there.
For tracking the hurricane and forecasts, I like the Weather Underground. Specifically on the hurricane, the WunderMap (r).
But, speaking of the wallet, it was returned this morning. Minus cash, but plus all the plastic and photos.
For tracking the hurricane and forecasts, I like the Weather Underground. Specifically on the hurricane, the WunderMap (r).
But, speaking of the wallet, it was returned this morning. Minus cash, but plus all the plastic and photos.
23 August 2011
My first earthquake
Yes, I was one of the many who felt the 5.8 to 5.9 earthquake centered in Virginia. The final scoring and location will come from the US Geological Survey -- http://www.usgs.gov/ This is the first time I've noticed an earthquake in my life. Growing up around Chicago and then living around here doesn't give you a lot of exposure. The strongest here that I've been present for was 4.3 to 4.4, as I recall it. I didn't notice it at all, not even in the sense of 'oh, so that's what was happening'.
This time, it was noticeable. The initial stage was some fairly minor, fairly high frequency vibration -- similar to having some heavy trucks drive past, or some kinds of construction drilling. Since there is construction going on in my area, I figured this was it. For the first few seconds. Then there was a rapid increase in the size of the vibrations, and a decrease in their frequency. Rather than having some vibrations passing through the building, we moved to having the building itself swaying back and forth. Earthquake!
By my count, I felt the quake for about 30 seconds. (If that's too long compared to the USGS figures, blame my inner ears.) Call it 20-30. One friend estimated the swaying as being 4 cycles per second in the real quake phase. My guess is closer to 2. I'll have to see what the USGS has. There are probably confounders from the engineering of my building. So far, all seems ok at work and home. Some of the more precariously perched items fell off book cases at home, but that's about it. Fingers crossed that this is true for everybody.
A question popular in our parking lot at work (we'd been evacuated post-quake) was to wonder what fault line caused the quake. My early answer, which was supported by a snippet on the radio (i.e., don't place a lot of confidence here) is that there was no fault line involved. This is simply a much stronger version of the usual earthquake for this region -- adjusting to the fact that the Laurentide ice sheet is gone. In areas that the ice sheet occupied -- down to southern Illinois or in to Pennsylvania -- the land sank under the weight of the ice sheet. This squeezed some of the more fluid parts of the mantle out from there, and over to the areas in front (south) of the ice sheet. That elevated the areas around, say, Virginia. Once the ice sheet was removed, the fluid started oozing back to its original location. As it does so, the crust creaks its way back in to position. Creaking = earthquake.
08 August 2011
Is climate a random walk?
Let's pick up again the discussion between Tamino and me. He has objected to my use of cumulative sums on the grounds that cumulative sums of random numbers have bad behavior statistically. He's correct about that statistical point, naturally, which means caution is needed regarding the statistical part of my post on finding a climate normal.
But how concerned should we be as climate scientists? Crucial to that concern is that climate be, to a fair degree, experiencing random variation. It isn't, strictly. As Tamino mentioned, there is certainly a trend in more recent years -- not purely random variation. His criticism is more one against the cumulative sums method. As Jim Bouldin mentioned in the comments recently, we do routinely transform variables in order to study topics of scientific interest. In his case, plants.
I'll start by showing you an illustration of why Tamino is concerned. This is a plot of the cumulative sum -- of a purely random variable, with uniformly random numbers in the range plus or minus 1 degree. This is actually about 10 times too large for climate. So the late period value of 40 really means 4 degrees.
 Each tick mark is 1 month, but assumes that each month's random number is completely independent of each other. That isn't the case, as Tamino has documented. This curve manages to accumulate its 4 degrees in about 200 years.
Er, it accumulates that climate wandering in only 200 years!. That and the smooth curves, suggest why we cannot take climate to be random wandering over long periods. Volcanoes suggest why we cannot do so for short periods either. Intermediate periods might be ok physically.
But how concerned should we be as climate scientists? Crucial to that concern is that climate be, to a fair degree, experiencing random variation. It isn't, strictly. As Tamino mentioned, there is certainly a trend in more recent years -- not purely random variation. His criticism is more one against the cumulative sums method. As Jim Bouldin mentioned in the comments recently, we do routinely transform variables in order to study topics of scientific interest. In his case, plants.
I'll start by showing you an illustration of why Tamino is concerned. This is a plot of the cumulative sum -- of a purely random variable, with uniformly random numbers in the range plus or minus 1 degree. This is actually about 10 times too large for climate. So the late period value of 40 really means 4 degrees.

Er, it accumulates that climate wandering in only 200 years!. That and the smooth curves, suggest why we cannot take climate to be random wandering over long periods. Volcanoes suggest why we cannot do so for short periods either. Intermediate periods might be ok physically.
Endogenous Retroviruses and a Different Writing Style
One of the blogs I keep an eye on is erv, Endogenous RetroViruses, by Abbie Smith. Not the usual language you'll see here (some over PG-13), and certainly different style (Abbie doesn't believe in the ', for instance). But for some discussion of biology, particular parts involving viruses and especially endogenous retroviruses (surprise), it's a good place to go.
I'll note that back when I was thinking about blogging, Abbie was one of the people who gave me some ideas on approach.
Some articles to take a look at for a sample of the blog:
What is normal, and how it matters in examining bees
Open Access Publishing -- and some limits
How immunization works
Antivaccinationism and death by measles
AIDS and CD4+ T-cells
Blood groups and viruses
Antibodies and dengue
Pursuing science and results
Zinc and the common cold
The Timetree of life
Scientists being slandered
Scientists and media
04 August 2011
Is it really normal?
Is my previous post about finding a climate normal really ok, or fatally flawed for statistical reasons? This wasn't how I was planning on doing so, but it provides a good chance to discuss some ideas about doing science and statistical versus physical significance.
In my note, I took a look to see if it was possible to find a period in which climate (as defined by the HadCRU temperatures) behaved in a way that we think of climate as doing -- some warming, some cooling, and totalling to no real change. That put me in mind of a cumulative sum, and the result was that it was indeed possible to find such a period -- 1850-1940. It could well have been that it was not possible to find such a period, or at least not one long enough to be interesting for climate. That would have told us that our notion of climate was not something that the climate system respected -- time to learn more about climate and update our thinking.
A second part of that post was my conclusion that something changed around 1940. This is a statistical conclusion, made by eyeball inspection. Quite a hazardous thing to do and Tamino shows ample reason to be leery of that conclusion, given the statistical nature of cumulative sums. On the other hand, the deviations he shows from his noise simulation reach only about 50, versus the 300+ of mine using real data.
So where are we?
02 August 2011
How to find climate normals?
It's that time of the decade when the official 'climate normals' are computed -- according to the rules of the WMO and NOAA (in the US). But can we find a better way of deciding 'normal'? I'll do some thinking out loud here, and invite you to play too. Could we even be so lucky as to find a way of defining climate normal in such a way that we don't need to worry about an early period of 'coming out of the Little Ice Age', or a later period of Anthropogenic Global Warming.
In previous posts, I illustrated that there are principles which lead to the requirement of 20-30 years to define a climate average and, separately, 20-30 years to define a climate trend.
In those approaches, we were able to make good use of the adage that climate is what you expect. It was only after 20-30 years of data that our expectations for the mean or trend would be stable -- would not depend sensitively on how long a period we chose to be our data period.
This time, I'll pick up with a different notion or description. A common description of climate is also that sometimes its warmer and sometimes it's cooler, but it all averages out in the end. Let's start by looking at the Hadley-CRU temperatures, back to 1850, month by month. I'll start with looking at temperatures relative to the average over the entire data set:
 For the earlier part of the record, we see the deviations being both above and below the reference value. On the other hand, the last 26+ years, every month since December 1984 -- 317 consecutive months, has been above the reference value. That's not a sign of sometimes warmer, sometimes cooler. That's the recent period being different from 'normal'. For instance, because of a warming trend. If you're younger than 26, you have never seen a month where the global mean was as cold as the 161 year average. On the other hand, looking at the early part of the record, we see some years warmer than 'normal' even though most are cooler. Further (look directly at the original data, don't take my word) there are no periods as long as even 20 years of continual below reference temperatures. In other words, the Little Ice Age, insofar as it was global, had ended by 1850.
In previous posts, I illustrated that there are principles which lead to the requirement of 20-30 years to define a climate average and, separately, 20-30 years to define a climate trend.
In those approaches, we were able to make good use of the adage that climate is what you expect. It was only after 20-30 years of data that our expectations for the mean or trend would be stable -- would not depend sensitively on how long a period we chose to be our data period.
This time, I'll pick up with a different notion or description. A common description of climate is also that sometimes its warmer and sometimes it's cooler, but it all averages out in the end. Let's start by looking at the Hadley-CRU temperatures, back to 1850, month by month. I'll start with looking at temperatures relative to the average over the entire data set:

01 August 2011
Giant Mutant Imperial Moths
Here's the title-bearer:

He's about 5", 8 cm from wing tip to wing tip. The reasons I call him a mutant are a little more obvious in this top view:
 He's got 5 legs. You can see the front left leg, and the doubled front right legs. The photo couldn't capture it, but I did verify two more back legs. He also seems to not have antennae, and moths do normally have some, including members of this family.
For completeness, here's the bottom view:
 For more technical information, see http://www.butterfliesandmoths.org/species/Eacles-imperialis
It was my first time seeing one of these. I had seen two other moths of this size -- a Luna moth many years ago, and a Polyphemus a few years ago while I was running in a 24 hour relay. Turns out they're all in the same family, the Saturniidae.
He was extremely patient with my photography and my wife going in and out of the sliding doors. Stayed put for several hours.
Like other members of this family, the adults don't eat. Go back to the top view -- no mouth parts. The adults try to reproduce, the females lay their eggs, and a few days later they die. Their main period of life is as a caterpillar. I've been calling this a male because it seems (the top link and further checking around the net) that the females are a more straightforwardly yellow. It is the males who have fair amounts of purple/brown.

He's about 5", 8 cm from wing tip to wing tip. The reasons I call him a mutant are a little more obvious in this top view:

For completeness, here's the bottom view:

It was my first time seeing one of these. I had seen two other moths of this size -- a Luna moth many years ago, and a Polyphemus a few years ago while I was running in a 24 hour relay. Turns out they're all in the same family, the Saturniidae.
He was extremely patient with my photography and my wife going in and out of the sliding doors. Stayed put for several hours.
Like other members of this family, the adults don't eat. Go back to the top view -- no mouth parts. The adults try to reproduce, the females lay their eggs, and a few days later they die. Their main period of life is as a caterpillar. I've been calling this a male because it seems (the top link and further checking around the net) that the females are a more straightforwardly yellow. It is the males who have fair amounts of purple/brown.
29 July 2011
Odds and Ends -- July 2011
A number of interesting items that are a little more time-related than I normally talk about.
Some sociology for amusement:
Nation's Climatologists Exhibiting Strange Behavior h/t Michael Tobis.
Regarding some of Roy Spencer's latest Well, give me more than 30 parameters, and I can fit a trans-dimensional lizard-goat ... by Barry Bickmore. I've downloaded the other recent paper and will take it up as my time and interest permits. A couple people have already asked about this, so read Barry's notes in the mean time.
Some fun science, and a reminder to beware of gifts bearing Greeks:
Phil Plait on Earth's first Trojan Asteroid
... and the NASA press release on it.
Trojan asteroids do not, it turns out, contain Greeks. Apparently that is limited to a horse in the Iliad. What happens is that if you have two bodies that are very much more massive than a third, like, say, the Sun and Earth compared to an asteroid, you can park an asteroid on the earth's orbit, but 60 degrees ahead or behind. And it will pretty much stay there. The 60 degrees ahead or behind are called the 'Trojan points'. We've long known of bunches of Trojan asteroids for Jupiter. As Phil's title suggests, this is the first time we've found one for the earth.
That's a bit about the doing of science: There was every reason to believe that the Earth had trojan asteroids. It would actually have been quite remarkable if we didn't -- gravity is supposed to work the same way for us as for Jupiter (allowing for the fact that we're so much less massive). Still, we're happier to see what we expected.
28 July 2011
Best Frenemies
A friend refers to another scientist as his best enemy. The important thing about this is, he is not angry or upset about the other scientist. I'll call them John and Jane, John being the one I know. John and Jane are both outspoken people. Consequently, at meetings the two of them spend a fair amount of time disagreeing with each other. And they disagree vigorously.
That vigor is part of what makes Jane a best enemy for John. John's not a quiet person himself. So it would be easy for him to vigorously say what he thinks is true and other people to quietly agree, because no other ideas were presented, or to quietly disagree. Quiet disagreement would be worse. It would mean that John would not have a chance to explain the parts of his thinking that would persuade those people that he was right after all. With a vigorous enemy, however, John can be confident that Jane will bring up those points that aren't clear to other people. And then John can explain them. After this, if anyone disagrees with him, there's a fair chance that it's because he doesn't really have things right himself. And he also has a chance to change his thinking, to arrive at something even better than what either he or Jane thought were the case when the two started their discussion.
The even larger bonus is that whatever conclusion John and Jane reach personally, they're confident that the entire audience knows what is the real topic of discussion, and why they each think as they do. This puts enough substance on the table for the audience to be making good decisions. If John's position isn't the one that some in the audience walk away with, that's fine. He's going to keep thinking about the topic himself and maybe decide that something closer to Jane's original position is more correct. Or maybe he realizes that there's a better way of describing why he thinks as he does. Either way, some scientific progress is made.
Another part of what makes it work is that their discussions, regardless of how vigorous (an uninformed observer might say 'violent'), are technical. Both of them have serious professional reasons for their conclusions. And it is those professional reasons they turn to, not cherry picking starting points for time series trend analysis and other dishonest or ignorant methods.
A final matter that makes it work is that neither of them is personally upset by the fact that they have professional disagreement. Both apparently rather relish it. After spending 8 hours at the meeting disagreeing with each other about almost everything under the sun, they go out to dinner together and chat pleasantly about other topics.
Strictly speaking, I only have 'John's view of matters. I don't know 'Jane'. Still, they've been doing it for decades now, and I think even of 'John' were extremely clueless about other people (and my observation is that he is fairly clueful), he'd have picked up on 'Jane's differing viewpoint.
Names and genders may well have been changed for the purpose of the story telling. The people and descriptions are otherwise accurate.
26 July 2011
How not to compute trends
Did you know that scientists are lying about the trend in sea ice extent? That's the conclusion if you apply the popular trend analysis technique those who claim that the earth has cooled, or 'not warmed', since 1998, or 2005. The probable reason you don't hear about this is that the 'lie' would be that scientists are grossly underestimating how drastic the trend to less ice is if you believe that method.
The method used to claim that there's a cooling trend, or no warming trend, is to cherry-pick a too-recent start year that is exceptionally high and compute the difference between that and a particular recent year (any one, repeat the 'no cooling trend for the last decade' for years afterwards, even if more recent years are warmer).
So I'll take a recent year that had large sea ice extent -- 1996, and compute the trend between there and a recent year that had a low extent -- 2007. Here's the straight line computed that way, plotted against the observations between 1996 and present. These data are September ice extents from the NSIDC:
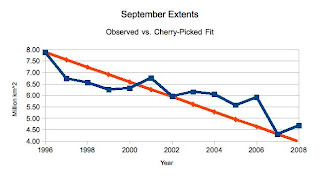 And from eye-inspection of it, it even looks like the average error is about 0. Sometimes high, sometimes low. This trend is for ice pack extent to lose about 330,000 km^2 per year, against the about 78,000 km^2 that is computed for a linear trend by climate scientists. Clearly climate scientists are trying to hide the decline!
I've already done some things more honest than what the 'no warming since 1998' folks do, not least is, I showed you the trend line and the data. But this is far from sufficient to have a reasonable trend analysis.
The method used to claim that there's a cooling trend, or no warming trend, is to cherry-pick a too-recent start year that is exceptionally high and compute the difference between that and a particular recent year (any one, repeat the 'no cooling trend for the last decade' for years afterwards, even if more recent years are warmer).
So I'll take a recent year that had large sea ice extent -- 1996, and compute the trend between there and a recent year that had a low extent -- 2007. Here's the straight line computed that way, plotted against the observations between 1996 and present. These data are September ice extents from the NSIDC:

I've already done some things more honest than what the 'no warming since 1998' folks do, not least is, I showed you the trend line and the data. But this is far from sufficient to have a reasonable trend analysis.
22 July 2011
Reconsidering forecasts and wagers
Comments in two different threads suggest that there's some good room for more discussion. Yesterday, I noted that if someone would only take a bet at 50 to 1 odds, he wasn't very confident about his side of the bet. Certainly not the 'just as likely to warm as cool' that was the statement which prompted the bet. (Nobody here, by the way.) As M commented, and I assume that he mean in terms of real money, he'd want 5:1 odds even on an even money situation. I wouldn't mind that myself (again, I don't bet real money, but in examining the mathematics of expectation, that's how it goes).
For illustration of a concept that was in my mind, but not in the prior post, I'll pick up with Alastair's comments about his predictions and preferences for odds. The thing is, the odds that you're willing to accept also describe what you think is really the case. At least it's much closer than in the case that your lunch money is riding on the bet and you're already hungry. Our situation here is betting something that doesn't exist (quatloos) and presuming that we can make a lot of bets, so that we can average out the wins and losses over time -- converging towards the mathematical situation.
I make use of this in group settings when lunch place selection is being discussed. In a group of, say, 6, all will claim to have no preference between places A and B. I pull out a coin and say, fine, heads it's A, tails it's B. An amazing number of people suddenly develop a preference for one or the other.
So it goes with Alastair's estimate of 3.9 million km^2 against mine of 4.4. His original estimate for uncertainty was 0.1 million km^2, while mine was 0.5 million. I'll add a curve for him, where the uncertainty is increased to match mine; that'll be the 'Alastair-2' curve:

21 July 2011
Sea Ice Wagers
I'll hang out the shingle here for folks who want to talk about sea ice wagers with me. Keep in mind that I don't bet real money, quatloos instead. Call them points of honor.
I don't take any of this very seriously. Seriously enough to mention that so far, I have won all my wagers of quatloos.
The serious part is how rapidly pseudoskeptics leave the room if one raises even a casual honor bet that takes their statements seriously. People who claim that temperatures are just as likely to go down as up demand 50:1 odds if challenged to a bet on whether temperatures will go up or down. If they believed what they were saying, they'd take 1:1 odds, and be happy with either side of the bet.
Last fall as I was evaluating the seaice ... statements from Wattsupwiththat , Joe Bastardi declared (over there) his belief that September 2011 ice would be at least 5.5 million km^2. If anyone can find Bastardi's address, I would be happy to bet quite a few quatloos with him. If he believed what he said, he should pay off infinity to my 1 if ice is less than 5.5 million km^2. I'll pay him 1 if it's over.
20 July 2011
Making your own sea ice estimates
The Sea Ice Outlook does accept estimates from outside the professional community. Maybe not everybody involved is thrilled by this, but I do think it's a good idea from my distant vantage. And Jim Overland, one of the people behind the SIO, is strongly in favor of it. (I had a chance to talk with him about the outlook and other ice matters a few weeks ago.)
In the most recent report, there are 3 submissions from 'outsiders' -- Chris Randles (you've seen him comment here as crandles) and Larry Hamilton, both at Neven's Arctic Sea Ice Blog, and one from Wattsupwiththat.
Watts' entry was a poll of readers. While perfectly legitimate as an entry, it's also perfectly useless scientifically. One goal of science is to gain understanding of the system in order to spread the knowledge around. Polling can't be spread.
Much more interesting are Chris's and Larry's methods. Both are obviously methods of great brilliance, as they currently have the same estimate as I do from my statistical method -- 4.4 million km^2 for this September. Beyond that, you can read their method descriptions in the Sea Ice Outlook report and start constructing your own method by not making the mistake they and I have made. Whatever those turn out to be. Larry Hamilton's write ups (one for ice extent, one for volume) are:
http://neven1.typepad.com/blog/2011/04/trends-in-arctic-sea-ice-extent.html
http://neven1.typepad.com/blog/2011/04/trends-in-arctic-sea-ice-volume.html
And you can also examine model output from the PIPS replacement model ACNFS, PIOMAS, and CFS as a basis for making your own estimates. (And please do cite others that you know of.)
All are welcome to post your methods here in addition to (or instead of) at the SIO.
19 July 2011
Adding to the blogroll
Finally got around, after broken wrist and other hiatus, to adding http://blogs.chron.com/climateabyss/ to the blogroll. Thanks -M for the suggestion.
Other suggestions welcome. As always, I aim for sources that lean to the educational -- science content rather than political policy.
Other suggestions welcome. As always, I aim for sources that lean to the educational -- science content rather than political policy.
18 July 2011
2011 Sea Ice Outlooks
For 2011, I added a third method of estimation. Or, rather, I talked with someone who was using a third method and helped refine it some. Our guesses are 4.4, 4.8, 5.0 million km^2 for September monthly average sea ice extent as computed by NSIDC.
Again, I'll put our estimates in context of some other estimation methods.
The two climatology means (22 and 30 years) are relatively close to each other, and are far away from anything we've seen in years. Taking the 30 year trend, from the first 30 years of the satellite record, gives 5.31 million km^2, which is close to a figure seen in recent years (5.36 in 2009), but well above any of our estimates or the 4.9 seen last year.
Below the fold for a few more words about our 3 estimates:
Again, I'll put our estimates in context of some other estimation methods.
- Climatology 1979-2000: 7.03 million km^2
- Climatology 1979-2008: 6.67 million km^2
- Linear Trend Climatology 1979-2008: 5.31 million km^2
- Wang, Wu, Grumbine model: 5.0 million km^2
- Wu, Grumbine, Wang model: 4.8 million km^2
- Grumbine, Wu, Wang statistical ensemble: 4.4 million km^2
The two climatology means (22 and 30 years) are relatively close to each other, and are far away from anything we've seen in years. Taking the 30 year trend, from the first 30 years of the satellite record, gives 5.31 million km^2, which is close to a figure seen in recent years (5.36 in 2009), but well above any of our estimates or the 4.9 seen last year.
Below the fold for a few more words about our 3 estimates:
17 July 2011
How large a conspiracy?
Did you know that the observed decline in Arctic sea ice cover is all just a fake? I didn't, but encountered folks who thought so. Since I'm one of the people who would have to be involved in the conspiracy or at least being duped by the masterminds, I'll take a minute to ponder the matter and how someone who does not personally know many of the people involved could go about deciding whether there was indeed such a conspiracy.
One of the tools I find useful in considering issues is to follow a common mathematician's approach -- called the reductio ad absurdum. That means reduction to absurdity. What you do is assume the thing at hand to be true, and then pursue it logically to see where you go -- whether it leads you to absurdity. This is also the starting point for a proof by contradiction. Again, assume the thing to be true and see if it leads logically to a conclusion that contradicts what you know to be true.
So let's assume that there is indeed a fake involved in the decline in Arctic sea ice. The people involved were a little particular -- the passive microwave sea ice record.
Some questions to pursue, then:
- How long would the conspiracy have to have lasted?
- How much data would have to be faked?
- Who all would have to be involved in the fakery?
- Are there other sources of data to confirm or refute the passive microwave observations?
16 July 2011
Happy Anniversary ...
... to me and my wife. Part of the recent hiatus is due to me taking some time off to celebrate my 5th wedding anniversary with my wife. I've marked this as a 'being a scientist' post since being a spouse is another thing that scientists do. I enjoy that, and others of my roles -- being a son, father, uncle, brother. Science is another, of course, and I enjoy that too, and is the point of the blog. But a secondary point is that scientists are people.
We took the time, among other things, to think about what we have done in the 5 years so far -- good ideas we've carried out, storms we've weathered, and so forth. And to think about what kinds of things we might like to try in the next 5. There's a bit of science there -- experiments. We try things, and some we like and keep doing, and some we don't, and quit. Probably none of these experiments are publishable, but that's not the point. We learn what we're trying to learn. And have a lot of fun along the way!
We took the time, among other things, to think about what we have done in the 5 years so far -- good ideas we've carried out, storms we've weathered, and so forth. And to think about what kinds of things we might like to try in the next 5. There's a bit of science there -- experiments. We try things, and some we like and keep doing, and some we don't, and quit. Probably none of these experiments are publishable, but that's not the point. We learn what we're trying to learn. And have a lot of fun along the way!
29 June 2011
Hiatus to end shortly
A heads up, warning, or promise of good things to come. Depends on your viewpoint. Still, my hiatus from blogging will be ending shortly, probably this weekend. Many things to come, including the longer write up of my September sea ice guesses (3 of them this time, and I'll constructed a combined guess), getting back to some things from the 'what is a day' and 'where is north' posts, and some things from the articles I'm finishing in the next few days for journal publication. That includes sea ice drift, evolutionary computing (two papers), and a topic to be named later.
25 May 2011
Hiatus
Granted there's something odd about writing two posts the day you are mentioning that you're on blog hiatus. Still, a bit of updating here in promise of things to come.
I haven't been napping the entire time that I've been silent here. Quite the opposite, really. One part being the running that I just posted. Another, and more interesting to the usual content of this blog is that I've been doing some science at home. Even some at work as well. The thing is, it takes enough concentration and concerted effort to do something novel at home, after a full day at work, that I don't get over to the blog.
The good news is that, knock wood, I'll be submitting an interesting paper that I've been working on at home for professional publication shortly. There are at least 3 stories involved in it. Unlike most scientific work I've done or been involved with, this piece has a well-defined starting point and history. The three will be the origin of the idea, carrying out the research at home, and what happened in/with the submission process. Note that I'm talking about submitting the paper; whether it gets published there or elsewhere, and what happens afterwards, will be a different story still.
A couple of interesting-to-here notes are also getting started at work. We'll see what happens with them. In both cases, the 'what is climate?' question is major.
Setting Goals in Running
One of the things I've been doing while on hiatus (which will, barring a couple of exceptions, continue for a while yet) is getting back to my running. (Yes, yet again I am getting back to running.)
Now that, knock wood, I am in reasonable health, it's time to be improving on that by getting active. Running is my prime way of getting active. Even though there's no logical or physical requirement, if I'm not running some, I also don't do other good things like lift some weights, do some rehabilitation exercises, do some core strengthening, and so on. So it's more important for me to run than if I were otherwise more virtuous.
At the end of April, my youngest son gave me an excuse that will help me with my goal setting process. Some people do fine with 'just do it'. Many people, and I'm one, do better with having a goal. My major goal is to complete that half marathon race next year the same day as my son. I'd say with him, but with little training he ran a time that I'll probably need a couple years of steady training to reach! So that's a nice goal itself, but how to get from here -- almost no running or other aerobic exercise in the previous 6 months -- to there -- running 13.1 miles (21.1 km) straight through?
05 April 2011
Starting to work with data
Let's suppose you have no particular axe to grind and are wondering about what 2011's average temperature will look like. What are some things you would do? First, of course, is try to get some data to work with. I'm choosing the NCDC global land and sea temperatures, annual average. If you prefer some other source, go with that. And if you're interested in something entirely different than this, have a go with that data source. I'll be talking about methods of dealing with data, not anything unique to annual average global mean 2 meter air temperatures.
Next is to do some basic looking around the data. That includes plotting it, finding the maximum, the minimum, the average, and the standard deviation. Since you're thinking about making a prediction of 2011, you also want to take a look at how things change from year to year. What does the plot of year to year change look like? What are the maximum, minimum, average, and standard deviations of change?
Next is to do some basic looking around the data. That includes plotting it, finding the maximum, the minimum, the average, and the standard deviation. Since you're thinking about making a prediction of 2011, you also want to take a look at how things change from year to year. What does the plot of year to year change look like? What are the maximum, minimum, average, and standard deviations of change?
04 April 2011
Messy Science
The type of science I like is what I call 'messy science'. 'Neat science' is the sort where you are looking at only one or maybe a few (easily counted) objects, which can be described by one or only a few number, like mass and momentum. Celestial mechanics is a 'neat science' in this way, at least for the solar system. Also, I hope, obvious is that being neat does not mean that it's easy.
Messy science is things like organismal biology or, for my own professional work, climate. In climate, you can take something simple, like the rotation of the earth, and wind up with a lengthy list of things which affect it. Conversely, you have a long list of things affected by it -- including the climate. In What is a Day?, I mentioned a few things which affect the earth's rotation.
Another thing that is involved is the fact that the earth's inner core -- sitting about 5000 km below us -- rotates at a different rate than the crust. In between the two is the liquid outer core, which has its own angular momentum, and whose top is about 3000 km below us. More recent work (that paper was published in 2000) is now suggesting that one can learn about climate by studying the earth's core's rotation -- here for the press release, or here for the Dickey, Marcus, and deViron, 2011 paper: Air Temperature and Anthropogenic Forcing: Insights from the Solid Earth.
What a lovely, messy, situation! We can look to the earth's core for signs about what is happening in climate!
I'll come back to this later for a discussion of the research paper itself. Maybe, like many new ideas, it won't hold up. If not, somebody else will get to write the paper which shows why not. In the mean time, here's another candidate for the messiness of climate. There's also another datum for how small the scientific community is. I've met the lead author; it was she who explained to me how it was possible to measure length of day variations to such very high precision.
01 April 2011
Says who?
I think citations are a greatly underappreciated part of scientific works. They also, for some of the same reasons, provide a way of assessing the strength of a source even if you don't know the topic that's involved.
My first real introduction to citations as being important was when a history teacher of mine in college was concerned that I'd committed academic dishonesty -- failed to cite a source for something she felt was obscure. After a nervous couple of minutes for me, we had a nice chat. What I'd done was to mention, without citation, Newton's prism experiment. I hadn't cited it because it was something I'd been seeing mentioned for years without citation, so figured counted as 'common knowledge' and not in need of a citation. My history teacher, on the other hand, had never heard of it before, so was looking for the citation to the person who had discovered the experiment (perhaps a citation to Newton himself; I now have the right book -- Newton's Opticks).
So that's one use of citations -- avoid annoying your teacher. Somewhat more generally, credit people for the work they do. That's an important thing in being a scientist, as the people you're giving credit to are your colleagues. Conversely, your colleagues will be peeved, to put it mildly, if you fail to credit them for their work.
The use at hand, as the title suggests, is to provide the backup for your claims. You could avoid some of that by providing full descriptions yourself, but then your article becomes impossibly long. Instead you can write something like "The earth is round[1] and rotates[2].", where you then give the full address to 1 and 2 somewhere later in the document (in print media days) or hyperlink the words directly. An alternate that I prefer is to provide the direct 'who' and 'when', such as "The earth is round [c.f. e.g. Aristotle, ca. 322 BC*] and rotates [Foucault, 1851]." In this way the reader immediately sees something about who your source is, and how old it is, and retains some merit even in a hyperlinking medium.
If you could read infinitely fast, it might be doable to simply read everything from everywhere. But for us humans, some means of trimming the candidates to manageable volumes is needed. So, for myself at least, if I'm trying to learn about a scientific topic, I head for scientific sources, or as close to the original as I can understand.
The bibliography/citation list is a quick way to figure this out. Places that are citing wikipedia articles, newspaper editorials, and so forth, for most of what they have to say are not strong sources. If the topic has scientific merit, there will be scientific papers on it. If I couldn't read, or would have a hard time finding and reading, the original scientific papers (which is true in most fields), then I want to be learning from someone who could and did. The strong source is one which is providing me the ability to go in to the literature and start learning about the particular part of the article which caught my attention.
This last is another important purpose of citation: It helps readers learn more. I would rather be learning the science from an author who is trying to help me learn it.
Now for the mirror test: How do my own postings hold up to that standard? In this post, it does ok, in the sense that this isn't about the content of science; it's my opinion of some things to consider in looking for sources from which to learn the science. In the science posts, not always as well as I'd like. So I'll take this post as a reminder to myself to include more references and links.
In my blogroll, two that are particularly good with their citations are Skeptical Science and RealClimate, though I think almost all are pretty good -- at least better than I.
*
c.f., I translate to myself as meaning 'See, for example'. It means that there's more than one source, and this is either the one that I used (though I know there are more), or that for some reason I prefer it.
Update: my self-translation is incorrect, see Nick and Peter's comments. What I really want is 'e.g.', for exempli gratia (free example is my translation here, unfortunately, it's my son who is the latinist.)
ca means 'about' (circa).
My first real introduction to citations as being important was when a history teacher of mine in college was concerned that I'd committed academic dishonesty -- failed to cite a source for something she felt was obscure. After a nervous couple of minutes for me, we had a nice chat. What I'd done was to mention, without citation, Newton's prism experiment. I hadn't cited it because it was something I'd been seeing mentioned for years without citation, so figured counted as 'common knowledge' and not in need of a citation. My history teacher, on the other hand, had never heard of it before, so was looking for the citation to the person who had discovered the experiment (perhaps a citation to Newton himself; I now have the right book -- Newton's Opticks).
So that's one use of citations -- avoid annoying your teacher. Somewhat more generally, credit people for the work they do. That's an important thing in being a scientist, as the people you're giving credit to are your colleagues. Conversely, your colleagues will be peeved, to put it mildly, if you fail to credit them for their work.
The use at hand, as the title suggests, is to provide the backup for your claims. You could avoid some of that by providing full descriptions yourself, but then your article becomes impossibly long. Instead you can write something like "The earth is round[1] and rotates[2].", where you then give the full address to 1 and 2 somewhere later in the document (in print media days) or hyperlink the words directly. An alternate that I prefer is to provide the direct 'who' and 'when', such as "The earth is round [
If you could read infinitely fast, it might be doable to simply read everything from everywhere. But for us humans, some means of trimming the candidates to manageable volumes is needed. So, for myself at least, if I'm trying to learn about a scientific topic, I head for scientific sources, or as close to the original as I can understand.
The bibliography/citation list is a quick way to figure this out. Places that are citing wikipedia articles, newspaper editorials, and so forth, for most of what they have to say are not strong sources. If the topic has scientific merit, there will be scientific papers on it. If I couldn't read, or would have a hard time finding and reading, the original scientific papers (which is true in most fields), then I want to be learning from someone who could and did. The strong source is one which is providing me the ability to go in to the literature and start learning about the particular part of the article which caught my attention.
This last is another important purpose of citation: It helps readers learn more. I would rather be learning the science from an author who is trying to help me learn it.
Now for the mirror test: How do my own postings hold up to that standard? In this post, it does ok, in the sense that this isn't about the content of science; it's my opinion of some things to consider in looking for sources from which to learn the science. In the science posts, not always as well as I'd like. So I'll take this post as a reminder to myself to include more references and links.
In my blogroll, two that are particularly good with their citations are Skeptical Science and RealClimate, though I think almost all are pretty good -- at least better than I.
*
c.f., I translate to myself as meaning 'See, for example'. It means that there's more than one source, and this is either the one that I used (though I know there are more), or that for some reason I prefer it.
Update: my self-translation is incorrect, see Nick and Peter's comments. What I really want is 'e.g.', for exempli gratia (free example is my translation here, unfortunately, it's my son who is the latinist.)
ca means 'about' (circa).
18 March 2011
Internationality of Science
Comments here and at Serendipity by Kooiti Masuda remind me yet again of the internationality of science. Not news to people in the field, but perhaps for younger readers. And the small world that science is.
Here, Masuda observed: Precise description of the polar motion by Hisashi Kimura (who led observations at Mizusawa) was a moment of demonstration that the Japanese can substantially contribute to the international scientific enterprise.
Today, of course, it's no surprise. But in 1899, when this was happening, Japan was new to the world science scene. The US wasn't exactly an old hand itself. While we'd had some individual excellent scientists before then (Ben Franklin, for instance), it wasn't until after the land grant universities (founded in 1850s and 1860s) had been at work for some decades that the US was noticeable in international science. Japan had an even later start and more rapid run up. Today, there are other countries going through the process of building their science infrastructures to the point of making significant contributions internationally.
Over at Serendipity, part of Masuda's comment is:
It reminded me another thought. There was a great development of computational geophysics in the latter half of the 20th century, including both climate modeling (Manabe, Arakawa, Kasahara), meteorological data assimilation (Sasaki, Miyakoda) and quantitative seismology (Aki, Kanamori), largely contributed by Japanese-American (born in Japan and emigrated to the USA) scientists. They made innovation by amalgamating the oriental tradition of precise numerical computation and the western tradition of rigorous logical mathematics. (I have not yet substantiated this interpretation, though.)
The very small world effect involved -- I have a connection with almost every person he names. Manabe would probably even remember me :-) after our chats in the 1990s, where I'd tell him how bad the sea ice was in his model and he'd cheerfully agree and then tell me about how good his results were anyhow. We were both right. Miyakoda, I've never met, but he's the reason that I've had sushi. My graduate advisor knew Miyakoda and apparently Miyakoda had a comment that nobody could be an oceanographer who hadn't had sushi. So after I'd successfully defended my thesis, my advisor took me out to a sushi place, thereby finishing my qualifications. Kanamori I wouldn't count except for some jr. high students. Namely, I'd attended a presentation of Kanamori's when I was in graduate school. Quiet a few years later, I went to talk to a jr. high science class. It turned out they were studying earthquakes, and their textbook had a personal profile of Kanamori. The kids were shocked/amazed/bewildered when I mentioned his sense of humor coming through in his presentation. The notion of a scientist having a sense of humor was pretty strange to them.
17 March 2011
Where is north?
Where is north is actually intensely tied to the question of What is a day?. At least we wind up defining it in much the same way(s) as we define the day. In the previous post, I gave a definition for north/south. Namely, the line of a shadow cast by the sun at solar noon (itself define by the fact that it's the shortest shadow of the day) is north/south.
As happened for the day, we find our most accurate definition from examining the stars other than the sun. The 'pole star' isn't actually one that we use for this. It's almost a full degree away from the actual pole of the earth's rotation.
What we do instead is look for day to day differences in the location of stars passing overhead or nearly so. This approach dates farther back than Seth Carlo Chandler, in the 1890s. But we'll be coming back to Chandler. If the earth has wobbled a little to the north, then the star will pass the zenith a little to the north of where it did yesterday. If you've got a good telescope and other instruments, you can observe this to pretty good precision. Chandler was working with accuracy of 1 second of arc or somewhat better for single measurements. Because of the power of using multiple measurements he was able to examine earth wobbles that were less than 0.1 seconds of arc.
This turned out to be quite useful, as the earth wobbles by about 0.3 seconds of arc. It's how he discovered what was promptly called the Chandler Wobble. This translates to about 3 meters motion in where the pole is.
The orientation of the earth is, as with the rotation rate, tied to where the mass is and where it moves to. The earth's orientation is believed to have changed by some millionths of an arc second due to the earthquake. The variations of a few tenths of a second of arc are caused by ... other things. Atmosphere and ocean circulations are what I'm most concerned about, but also the earth's inner core, and the moon, and .... It's a messy business.
As for the length of day, your scientific source for observations is the International Earth Rotation Service. Which, itself, owes something to Chandler.
16 March 2011
What is a day?
Some friends have been puzzled about how an earthquake or a tsunami could change the length of a day. This question comes, of course, from the tremendous earthquake in Japan. I trust you're all aware of it, the severity, and are doing what you can. Given how late I am to comment at all, I'll take up my friends' puzzlement.
As is common in science, once you get detailed about just what you are talking about, you also understand much about the thing. So: What is a day? There are really at least 4 different definitions of 'day' that we can fairly easily point to. Only two of them are still in serious scientific use. One is commonly used, kind of. And the one with the longest history is no longer in use.
What we need, in order to define a day, is something that takes 1 day to happen. The longest history for a meaning of 'day' is: "The time between maximum elevations of the sun." Almost equivalent would be time between sunsets or sunrises. Maximum elevation of the sun is a much easier and accurate measurement to make. Don't look at the sun! You also don't need to. Get yourself a stick and put it straight in to the ground (on a desk, sheet of paper, ...). Be sure that the ground is flat and the stick is vertical. Every so often through the day, mark where the shadow ends. At some point, the shadow will reach itsgreatest shortest length. That's solar noon. The direction of the shadow (if you're in the northern hemisphere mid or high latitudes) is north. (There's more fun to be had by repeating this exercise many days through the year.)
This notion of 'day' is affected by earthquakes, since it depends on how fast the earth is rotating. (This also makes it one of the more obscure ways of showing that the earth does rotate.)
As is common in science, once you get detailed about just what you are talking about, you also understand much about the thing. So: What is a day? There are really at least 4 different definitions of 'day' that we can fairly easily point to. Only two of them are still in serious scientific use. One is commonly used, kind of. And the one with the longest history is no longer in use.
What we need, in order to define a day, is something that takes 1 day to happen. The longest history for a meaning of 'day' is: "The time between maximum elevations of the sun." Almost equivalent would be time between sunsets or sunrises. Maximum elevation of the sun is a much easier and accurate measurement to make. Don't look at the sun! You also don't need to. Get yourself a stick and put it straight in to the ground (on a desk, sheet of paper, ...). Be sure that the ground is flat and the stick is vertical. Every so often through the day, mark where the shadow ends. At some point, the shadow will reach its
This notion of 'day' is affected by earthquakes, since it depends on how fast the earth is rotating. (This also makes it one of the more obscure ways of showing that the earth does rotate.)
14 March 2011
Running in the rain
It was raining, of course, this past Sunday when I went to the track for my second run since breaking my wrist while running last fall. (First having been Thursday.) I've previously talked about running with lightning (i.e., don't!). But my negativity about being electrocuted* should not be taken to apply against running in the rain. A number of my favorite runs have been in the rain. Probably a higher fraction than in 'nice' weather.
Running in the rain becomes pleasant once you make some attitude adjustments, and perhaps do some physical preparations. Bonuses are that you can congratulate yourself for your tremendous virtue in being out in spite of the unpleasant weather. And if you race, it's a plus because even though you could arrange to do all your training in nice weather, you cannot ensure that all races will have nice weather.
The main attitude adjustment is one suggested by a fellow trail runner. We were going to run on trails during moderately heavy rain, after 2 days of steady, heavy rain. Our path was all dirt except for a stream crossing. In other words, after all that rain, no question that we were going to be soaked, and muddy, and soaked again (by the stream). As he said, it was time to let our inner child out to play -- splash through the puddles (which were numerous) and enjoy the mud. I won the contest for having the mud highest on my body (up near the shoulder blades) without having fallen.
Physical preparation starts with the fact that you are going to get soaked. So relax about that part. During the run, get wet and don't worry about it -- assuming that you're not running with too little clothing on, and temperatures are low enough to make hypothermia an issue. (If that sort of thing is a consideration, get out of the rain immediately.) But a spring rain, like I had Sunday, with a warm house or car nearby, and adequate clothing ... enjoy. The thing is, have two sets of clothes. One for running in, and one for immediately after you finish running.
23 February 2011
Science Fairs
Last week I had the pleasure of judging at the Eleanor Roosevelt High School science fair. The pleasure was only added to by the breakfast, snacks, and beverages provided by the ERHS PTSA. Program organized by Jennifer Massagli
The main fun, as always, was talking to the students. But I'll also make some comments here for students who are thinking about next year's science fair projects. One part of the fun (for judges) being to talk to the students, I'll advise that students act like they're interested in their projects. "Here is something I slapped together because the school made me." even if true, is just not the way to your judge's heart. I also make this comment to graduate students and scientists about their presentations. Many people don't act interested in their own work. Trust me, if you aren't interested, we won't be either.
Fun parts of the talk include finding out what prompted the student to do their project and where they might take it in the future. Also an important part of a professional presentation. One student I spoke with was looking at the output of solar cells, how they depended on light sources and filters. This is sufficient reason for the science fair project, and he explored that question ok. But it became much more interesting to me when I discovered that he was using the solar cells as proxies for plant photosynthesis. Plants do rely on the sun, as do solar cells, and there are degrees to which you can indeed use solar cells to map out plant responses.
A different line of interest for me is to see what the students think of to investigate, and how. Many different sorts of things investigation, and many ingenious ideas on how to get the measurements. Both are good areas to use and show your creativity, which is one of the areas on the official scoresheet.
21 February 2011
The Invention of Air
It isn't often that I wind up able to talk about a book, science, a scientist, and my genealogy in the same post, but Steven Johnson's The Invention of Air manages that feat.
The book is a pleasure to read. Johnson's linchpin is Joseph Priestley's life and science. I'd always thought of him as an English scientist, which turns out to be only partly true. He finished his life in the USA, corresponding particularly with Thomas Jefferson both in revolutionary and post revolutionary days. The Jefferson connection (and before that, Franklin) make for some interesting reading and historical insight outside of science as well as inside.
In his writing on Priestley's science, Johnson captures some of my themes about scientists being people, having lives, and those having some influence on what work they do and how they do it. Also nice to see was that Johnson did not take the oversimple telling of 'good guy / bad guy' for Priestley's advancing the phlogiston theory and holding on to it longer than most.
To back up, as not everybody already knows, Joseph Priestley was one of the major chemists of the 1700s, most known perhaps for 'discovering' oxygen, but also (and Johnson makes a good case that this was the more significant) that plants release oxygen and consume carbon dioxide. His approach to his research, though, was not the stereotypical one step leading to the next with some ultimate conclusion drawing ever closer. It was more the 'try many things and see a) what happens or b) what works'. And he then was active in describing how it is he did his experiments, as often the method itself was the important aspect of the work.
If you know a young scientist, I'll suggest you get this for them as well and not just yourself.
The genealogy I'll put below the fold. For here, it suffices that I'm not a descendant of Priestley's.
05 February 2011
The Way Things Break
The Way Things Break is the blog of thingsbreak, who comments here as well. As you'd expect, content isn't a perfect overlap of mine, which is one reason to suggest it. The articles I mention below will lean to climate, but take your own look. Especially, check out the Books of Interest and Open Source Climate Science Education.
Cosmic Rays 1
Reliable sources and ocean acidification
Geoengineering and ocean acidification
(2009) Arctic summer sea ice
Lonnie Thompson viceo
Cosmic rays and climate 2a
Cosmic rays and climate 2b
Reducing greenhouse emissions through household actions
Who is really alarming?
Tropical cyclones and consensus
Climate communication and public health
What was really predicted about ocean circulation?
Media vs. scientific description of climate report -- See also the comments, especially John Fleck's.
01 February 2011
Question Place
Finally back and in some shape to answer questions and perhaps even do something useful with suggestions, so bring 'em on and let's have some fun!
26 January 2011
Rabett on History of Radiation
No surprise to you that I'm interested in the history of science and of knowledge, but perhaps a little surprising that I'm not the only one. Eli Rabett has recently taken up the history of our knowledge on atmospheric infrared radiation.
http://rabett.blogspot.com/2011/01/required-reading.html Ångström observing infrared radiation from the atmosphere
http://rabett.blogspot.com/2011/01/angstrom-effect.html Arguing for 'Ångström effect' as the name rather than greenhouse effect
but then joining many of the rest of us in 'Callendar effect' in http://rabett.blogspot.com/2011/01/well-damn-it-all-its-callendar-effect.html
http://rabett.blogspot.com/2011/01/fourier-and-greenhouse.html More about Fourier and the term 'greenhouse effect'
I'll also take this chance to recommend The Callendar Effect as being a readable introduction both to the biography of the engineer/scientist who did the work, and to the science that he did on carbon dioxide as an important driver of climate change. I also have the complete papers, one of which and its response have some interesting, to me at least, illumination regarding the difference between being skeptical and being in denial.
24 January 2011
Whiteboard on the end of global warming
The Whiteboard also has a series (now looks to be finished) on whether global warming has 'stopped'. That's what prompted the series I linked to last week. The question is pursued statistically, following the lead of Tamino at Open Mind. The brief summary of the series is 'no'. But it is well worth looking in to the series for the how and why we can say this, and how strongly we can say it.
Did Global Warming Stop After 1998?
Did Global Warming Stop After 2000?
Did Global Warming Stop in 1940?
Did Global Warming Stop After 2007?
For looking at the converse, global cooling:
Did Global Cooling Stop in 1970?
These are more mathematical takes than my old What cooling trend? They come to the same conclusion, so those who'd like more math behind their conclusions can get it. Since I did that post over a year ago, it's probably time for an update. One of these days ...
21 January 2011
Wrestling with data
I'll suggest those who haven't been, join me in keeping an eye on a series of posts that Ron Broberg is doing over at The Whiteboard. As befits a whiteboard, he's showing a lot of the details that get cleaned out of most final publications, even on blogs. The topic at hand is looking at the temperature records since 1880 and testing ideas on fitting curves to the data. The series is now to #9 and it's apparent that there will be several more:
http://rhinohide.wordpress.com/2011/01/07/lines-sines-and-curve-fitting-1-oh-my/ (Starts out more on the issue of testing ideas on what we can conclude about temperature trends)
http://rhinohide.wordpress.com/2011/01/08/lines-sines-and-curve-fitting-2-r/ (try fitting the sine and then a line)
http://rhinohide.wordpress.com/2011/01/09/lines-sines-and-curve-fitting-3-double-down/ (Try fitting 2 sine waves)
http://rhinohide.wordpress.com/2011/01/10/lines-sines-and-curve-fittings-4-walk-and-chew-gum/ (Simultaneous line and sine fit.)
http://rhinohide.wordpress.com/2011/01/12/lines-sines-and-curve-fitting-5-a-growth/ (Trying an exponential curve)
http://rhinohide.wordpress.com/2011/01/14/lines-sines-and-curve-fitting-6-backcast-and-forecast/
http://rhinohide.wordpress.com/2011/01/15/lines-sines-and-curve-fitting-7-normal/ (Testing Normality 1)
http://rhinohide.wordpress.com/2011/01/16/lines-sines-and-curve-fitting-8-dagostino/ (Testing Normality 2)
http://rhinohide.wordpress.com/2011/01/17/lines-sines-and-curve-fitting-9-girma/
A sine is a standard oscillation. It would be a pure tone (rather flute-like) in music. For a bit more about oscillations and data series, and the language of time series analysis, take a look at my Introduction to Time Series Analysis.
20 January 2011
Help save data
You've noticed by now the frequent pleas from people studying climate for more data, particularly from the past; here's your chance to help: Data Rescue at Home is working to retrieve hand-written climate records to make them useful for modern science. The catch being exactly the fact that they are hand-written. It is best to have a person looking at the writing to decide whether that squiggle is a 9 or 7 (to name one that confuses others who try to read my writing). You can be that person.
19 January 2011
Penguins
A couple of people have guessed where my 'penguindreams' id comes from, but there's a little more to it. The obvious part is the collection of Bloom County cartoons which were collected as Penguin Dreams and Stranger Things. There can be strange things here, so it seemed appropriate. The penguin part has less to do with Opus, and more to do with a platypus.
The platypus is itself a story. When I was younger (not that I'm not currently young, but back then I was less practiced at it), my sisters each had an animal they collected. Somehow it was deemed that I should also have an animal that I should collect. I didn't want to do so, so I spent some time trying to think up the most unlikely animal possible. Platypus was what I finally hit on. That served me well. No platypi found their way to me until I was well in to college, when my grandmother had found a pattern and made one.
I was safe again until I reached graduate school, when I started working on the Antarctic. Immediately it was decided that penguins were now my animal. So I've got quite a few penguins, of one sort and another. They did give my (now) wife pause back when we were dating and she saw the penguin collection. Fortunately she believed this story. And I've grown to like the penguins.
18 January 2011
Was Easterbrook talking science?
A friend suggested that I take up this article by Don Easterbrook, on comparing 'present' temperatures to those of the past 10,000 years or so. The article is severely flawed, as has been discussed at Hot Topic and In it For the Gold. Since that set of flaws has already been discussed at some length, I'll look to different issues with it. (I'll add that you can check out a couple comments I made over at Hot Topic.)
The most fundamental issue, I think, is one I've posted about previously -- But is it science?. There's a strongly related side trip to cherry picking. Good science doesn't engage in cherry picking, so that becomes related to questions about whether we're reading a science article or something aimed at politics or other.
That fundamental issue shows up with the title: 2010 -- where does it fit in the warmest year list? That isn't really even a question for or of science.
17 January 2011
Back and becoming active
I'm now back to checking out the blog -- at least comments people have submitted. So, please take a look at:
Stephen L. at Verifying Forecasts 1
William at Verifying Forecasts 2 (two comments)
Horatio Algernon on Kids are Scientists
Bayesian Bouffant, FCD on Kids are Scientists (giving us a link to a 10 year old who discovered a supernova!)
jyyh on Evolving Thoughts
I'll be posting original material myself shortly. William's discussion is prompting a separate post or two. There is an interesting to me point involved, which is helpful for many things in pursuing science regardless of topic. Namely: What is your object of study? How do you know?
Hope everybody had a good winter solstice (December 21), holiday season, new year, and perihelion (January 3). We're now moving away from the sun and those of us in the northern hemisphere are seeing more light. (Itself a point important to long term -- tens of thousands of years -- climate.)
My wrist has been recovering pretty well, as these things go. Unfortunate, that does not mean complete recovery 2 months after surgery. But the physical therapy is going ok (as these things go) and I can now type fairly normally.
Subscribe to:
Posts (Atom)

